Jacqueline CHEN 陳美芝
Why bees?
The bee is the main agent for cross-pollination: it carries pollen to another flower.
The main function of bees is pollination. 2% of wild bees on the planet are responsible for pollinating 80% of the world’s crops. This is not only reflected in the production of food for humans, but also the feeding of an entire ecosystem. Without pollination, there will be no food for most birds, insects and other animals, the entire food chain suffers, animals die and the ecosystem is destroyed.
In addition, bees contribute to biodiversity on the planet. Bees pollinate wild flowers that enrich landscapes and gardens. During its trip, comes across plants, soil, water and air. In this way, polluting particles can be stored in their body, and their analysis can show whether the place where the bees passed has high levels of atmospheric pollution.
So…What kind of data existed about bees?
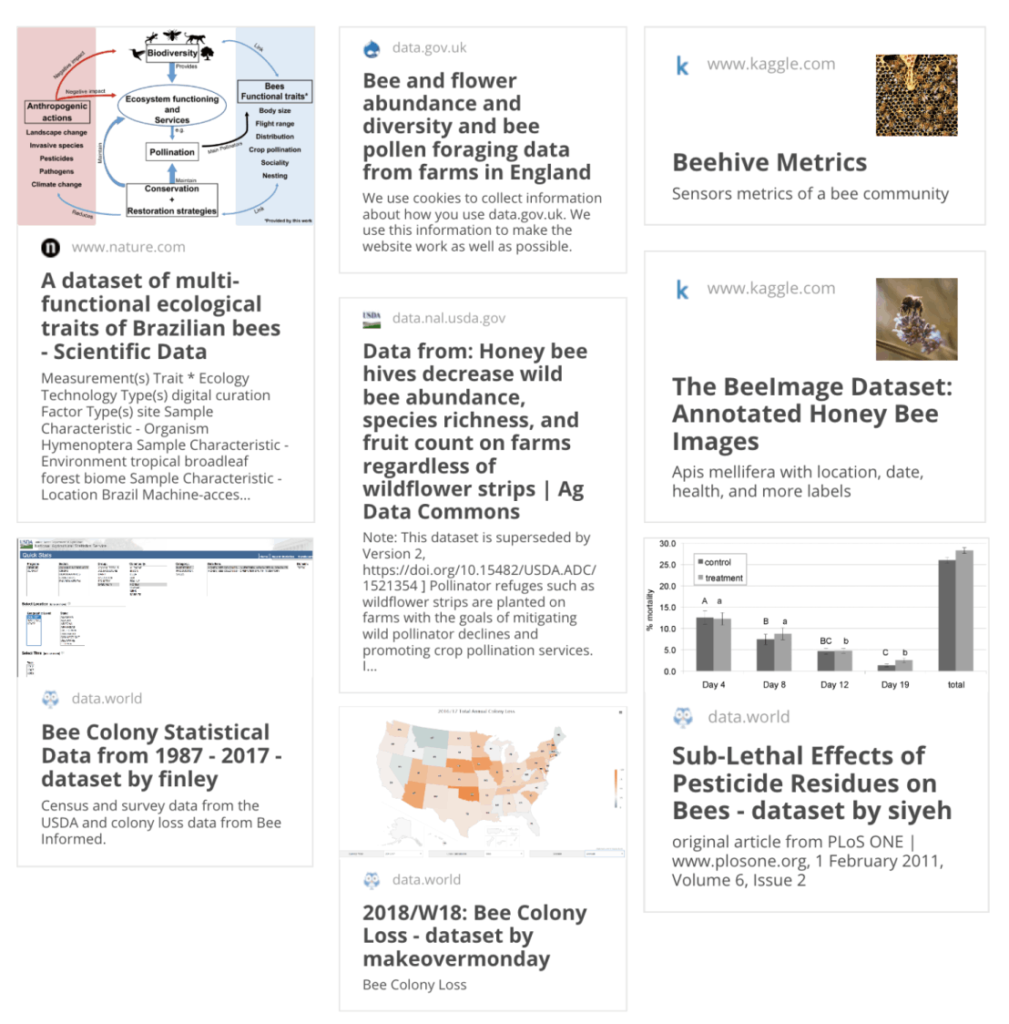
Dataset
In the beginning of the research it was very important to know that a research idea should come through available datasets to understand which data I could work on.
The initial ideas done for the previous brainstorm was the opposite: to bring in a research interest and then see if there was data to support it.
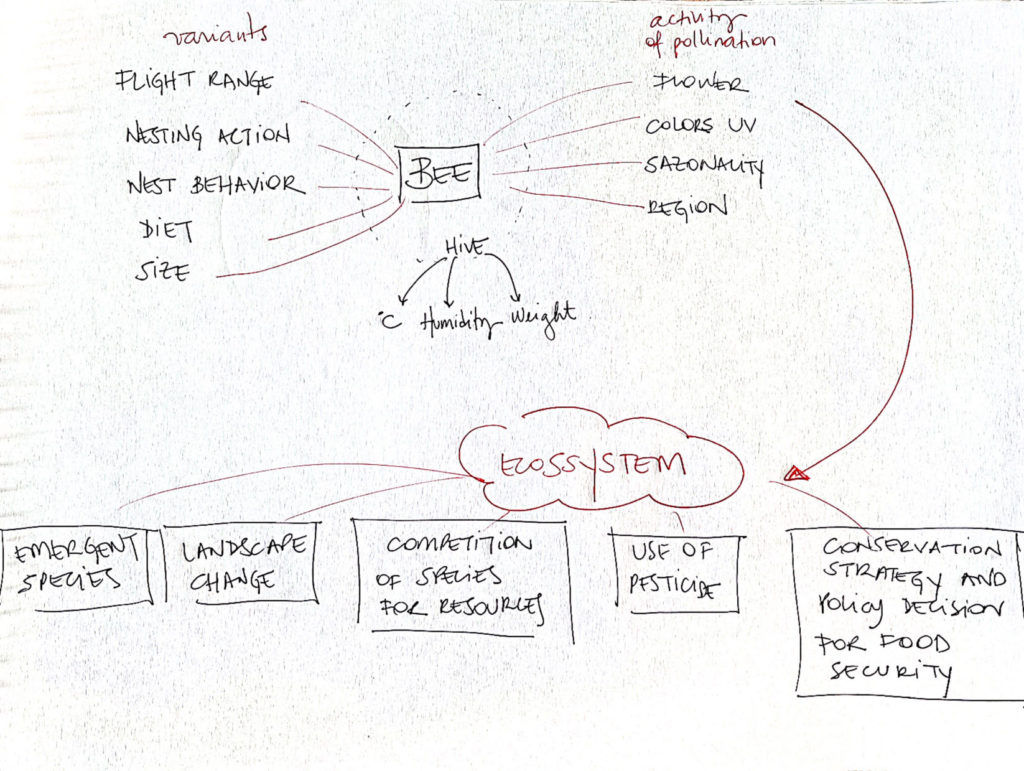
Throughout the research on the data bases, factors emerged that are crucial for understanding the pollination process by bees. Physiological characteristics, routine of each bee species, of the hive, directly influence what it offers to the Ecosystem. And each of these characteristics has a vast potential for study.
These were factors that in the first stage were not considered. For example, I had not considered the variety of species, that a product can be pollinated by more than one species. Functional differences between native and captive bees, with and without stingers, among others.
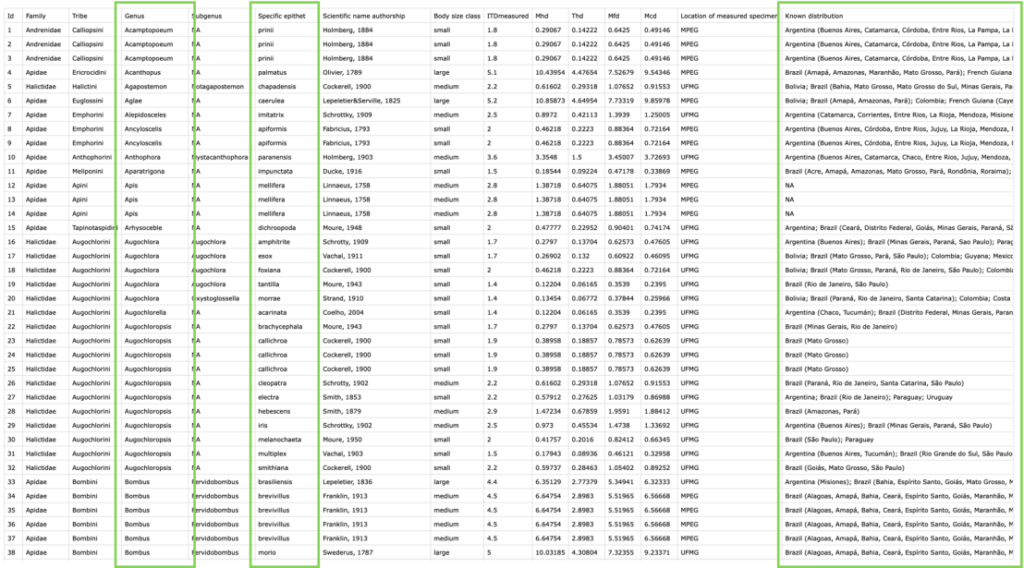
Dataset of ecological traits of Brazilian Bees
-Kind of bees from a region of Amazon. Period: 1983 to 2018
-Information of body size, flight range, distribution, crop pollination, sociality and nesting of 328 species.
-Species traits for Brazilian bees that are of significance to ecology and conservation
A total of 328 bee species have been recorded in these two areas, corresponding to more than 20% of the estimated 1500 bee species recorded in Brazil
Based on the dataset and research, I managed to go deeper than simply “bees are important to the world”.
1st try DataVis
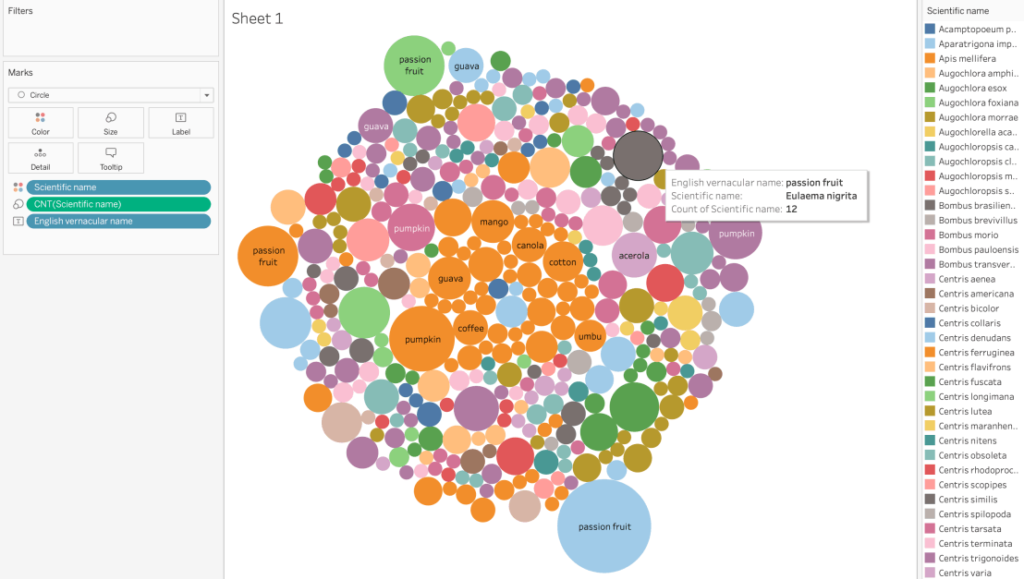
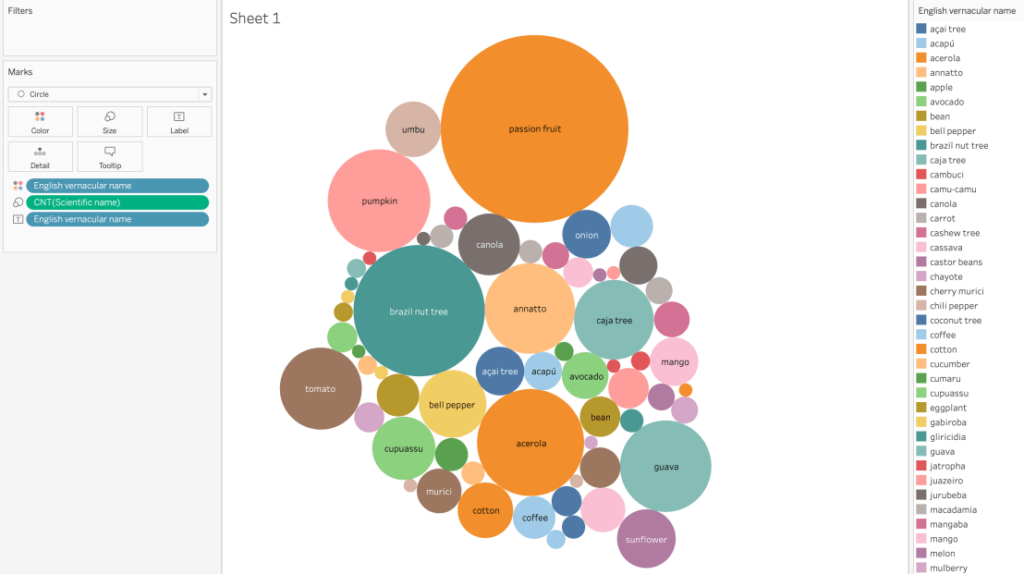
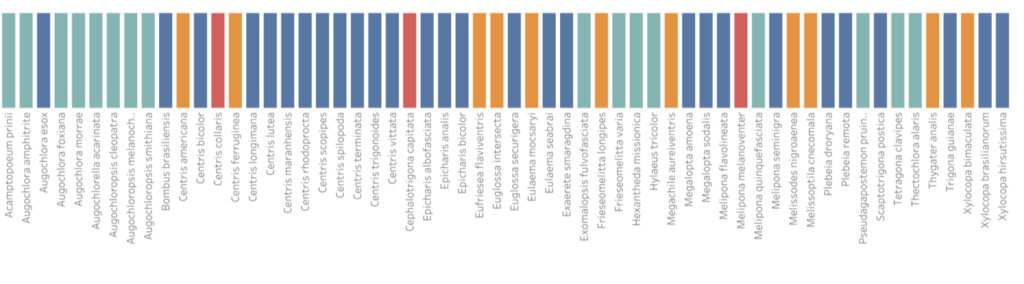
In the first visualizations, I tried to understand, through packed bubbles, the relationship between bee species and products. I realized that I had not chosen the best chart because visually the proportions between species are not clear, and there is a great repetition of colors that confuses the visualization.
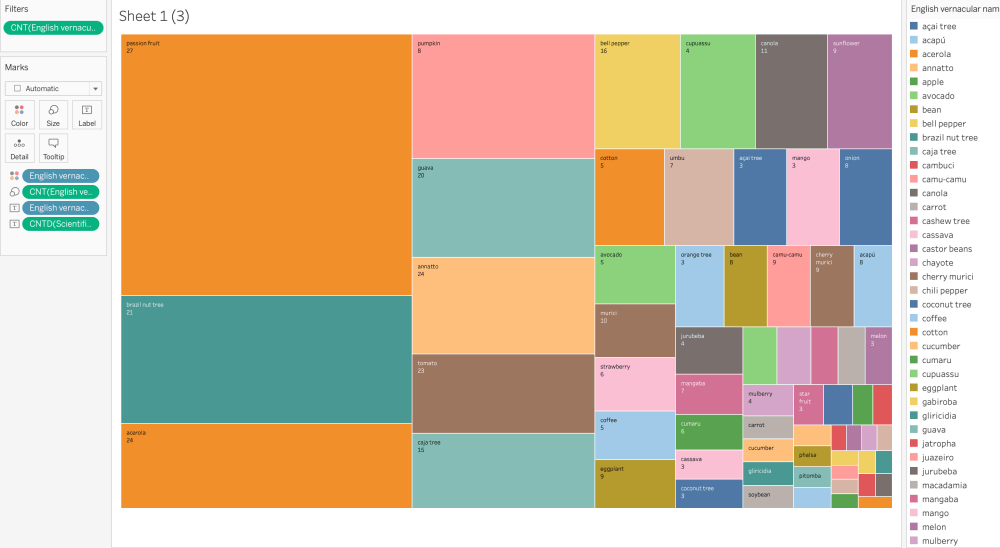
Then I analyzed the data using HEAT MAP and TREEMAP.
In these maps I was able to better visualize the number of species and the proportion of products pollinated by them.

Heat Map
A lot of joint information, having to rely on the legend every time you look at information
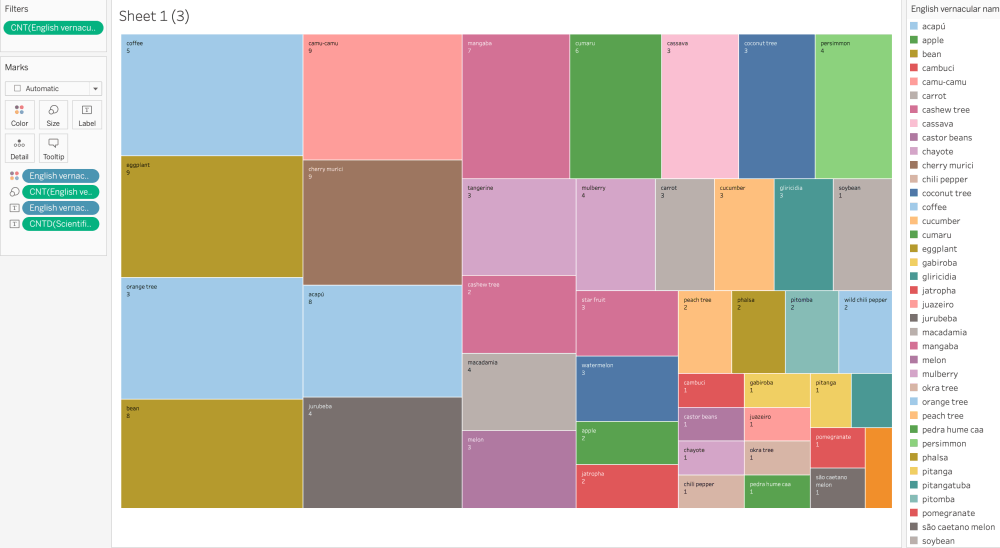
Tree Map
Impossibility of having all the texts of the existing species, thus lacking data
Species x Products (all)
All products from the base
Species x Products (27 to 5 products/bee)
Table filtered from 27 to 5 products per bee species and noticed that there were still many species to be analyzed and that would have to filter even more
Dividing in Product Groups
These graphs divided by groups served to reinforce that fruits and vegetables were the main masses for species that pollinate more for those that pollinate less. But through this type of graph the visualization is still not clear to see which are all the species contained in each group to draw some other conclusion.
I found the need to filter the information to search for a topic relevant to the research community. At this point, I saw that knowledge outside the databases would help me filter for more targeted information. For example, species such as Appis Melifera, Trigona spinipes, Xylocopa frontalis, are the best known and there is a lot of research on them. So the subject search within the visualization should be relevant to the research community and not bring up “obvious” topics.
Brazil is the largest tropical country, so general data that has a lot of variety of fruits and vegetables are also conclusions already known without needing great depth in this database.
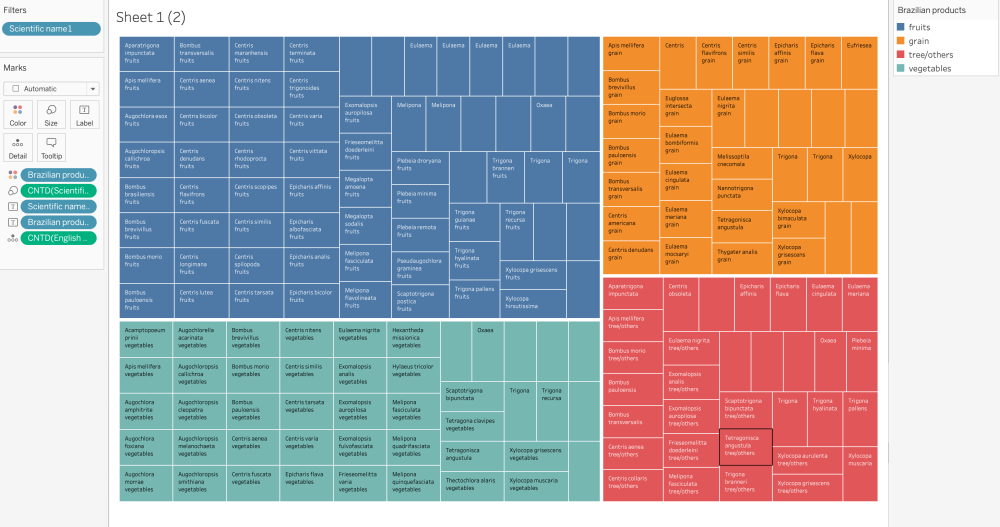
Species x Product groups
With the amount of information, I chose to separate them into groups to understand the proportion between fruits/vegetables/grains/tree – other (others include flowers, leaves, non-fruitful trees).
As expected, fruits and vegetables make up the majority of the products pollinated by bees.

Product per specie
Species with total amounts of products that pollinate (max 27 – appis mellifera)

Max of 10 products per specie
Filter for the amount of maximum 10 products that was pollinated by species.
Final Visualization: Horizontal bars
In this visualization, I thought the amount of products per species contained in the base was very clear. I followed up with all the steps I had done previously, but in this view.
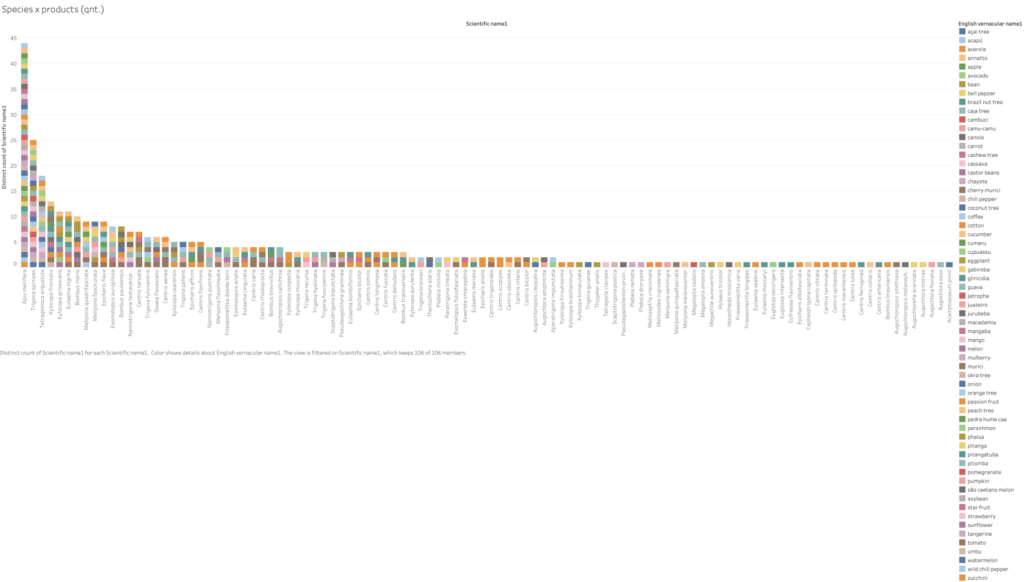
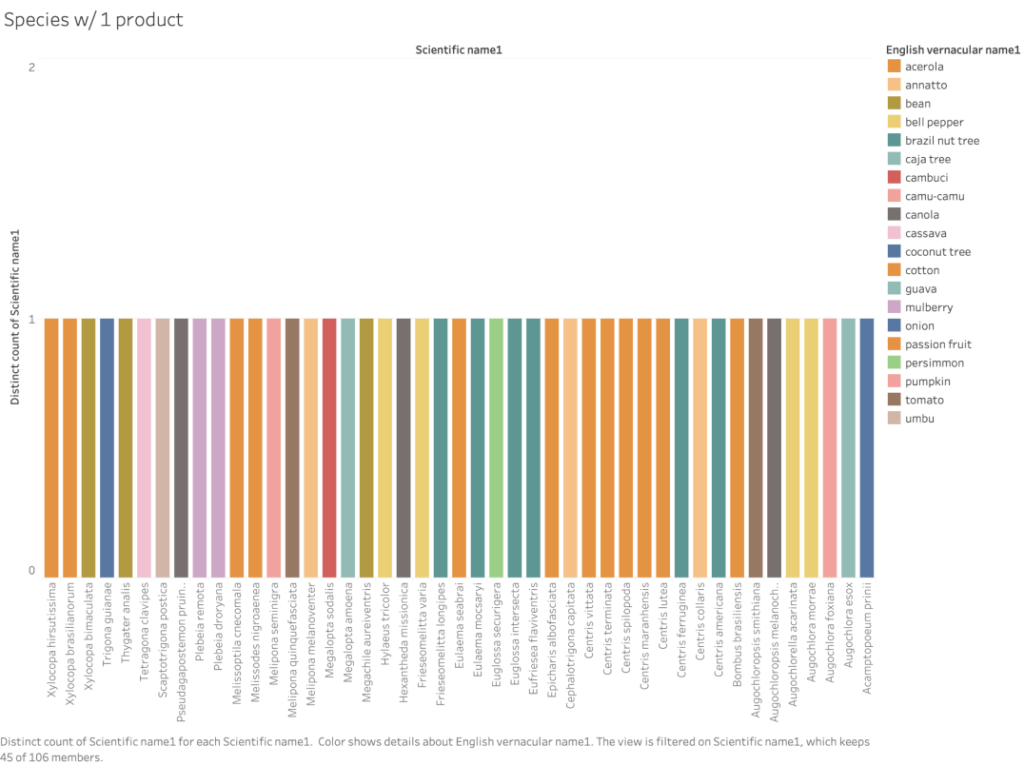
Species x Products
I organized them in descending order, to see how many and which species pollinate 1 single product
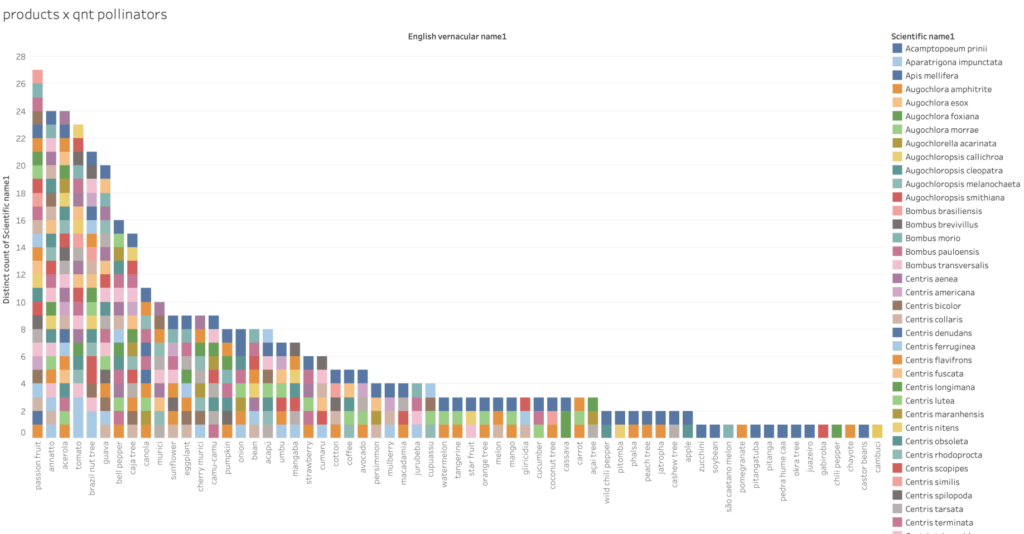
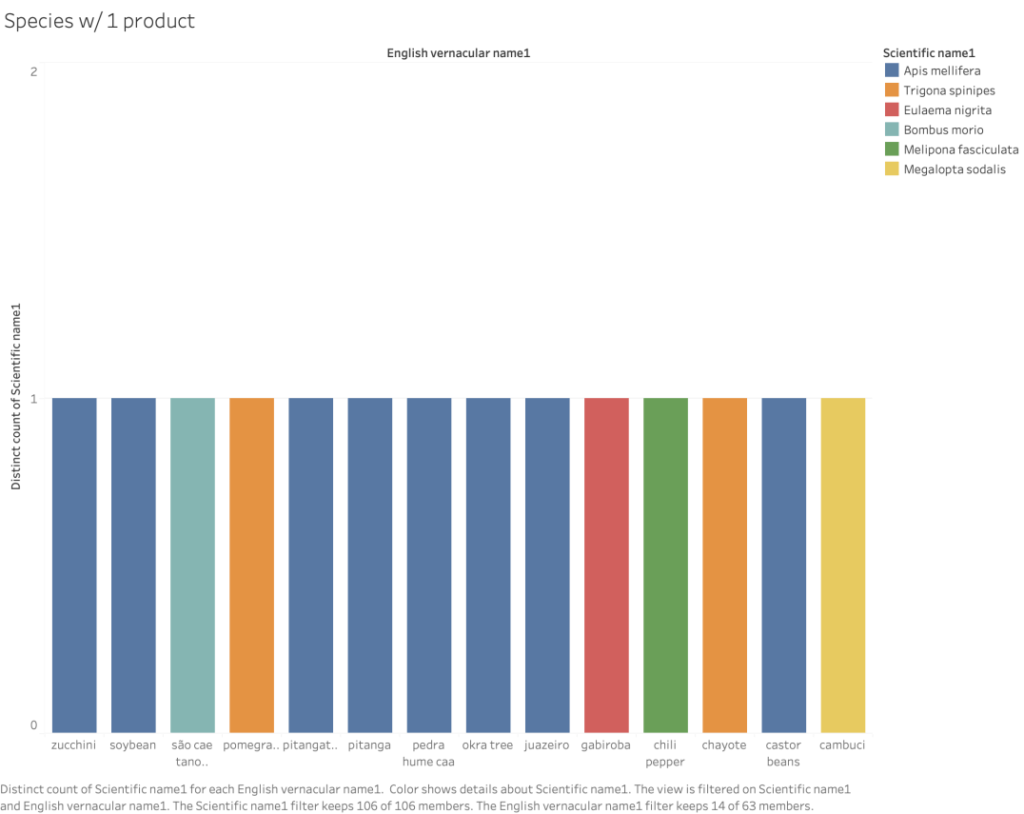
Products x Species
Inverting the axes to see how many pollinators per product you have.
Species who pollinate only 1 product
Product just pollinated by 1 specie
If these species did not exist, these products would no longer exist, or there are other forms of pollination. Ex. Soybean – wind pollination
A quick conclusion that other ways can be drawn from this visualization is that these species don’t exist, these products no longer exist, or else they exist from pollination.
Soybean is one of the most produced products in Brazil. And it sounds a little strange for a large production to be tied to a single type of pollination by just a single bee. Knowledge outside the database should complement what you get from visualizations. We know that there are also other ways of growing soybeans, such as wind pollination. This shows the importance of cross-referencing knowledge outside the database as well.
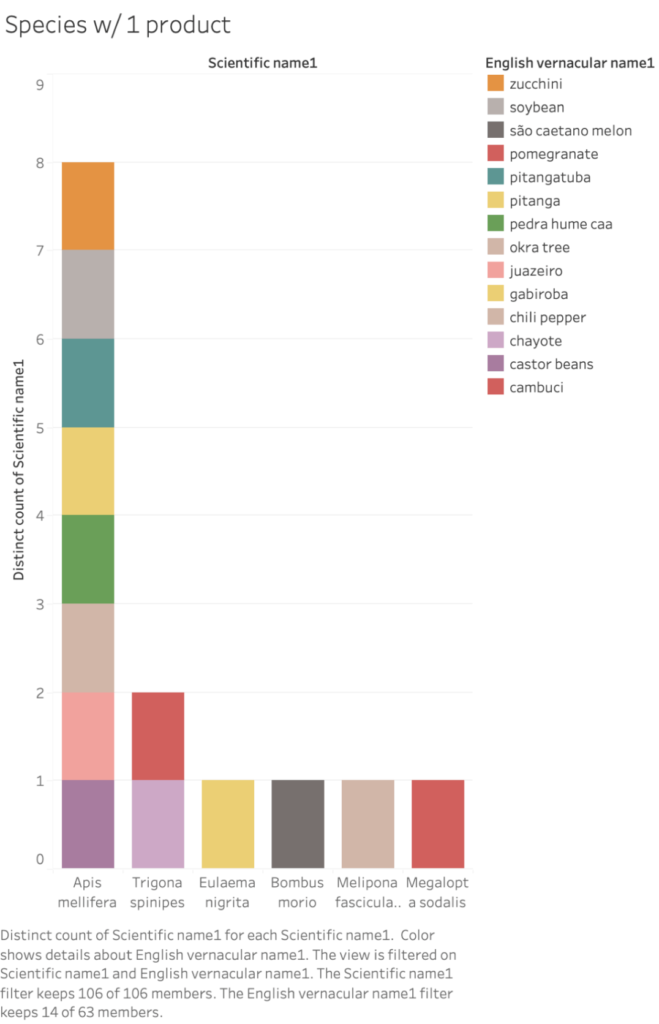
Product just pollinated by 1 specie
Inverting the axes to see how many products are pollinated by that specie.
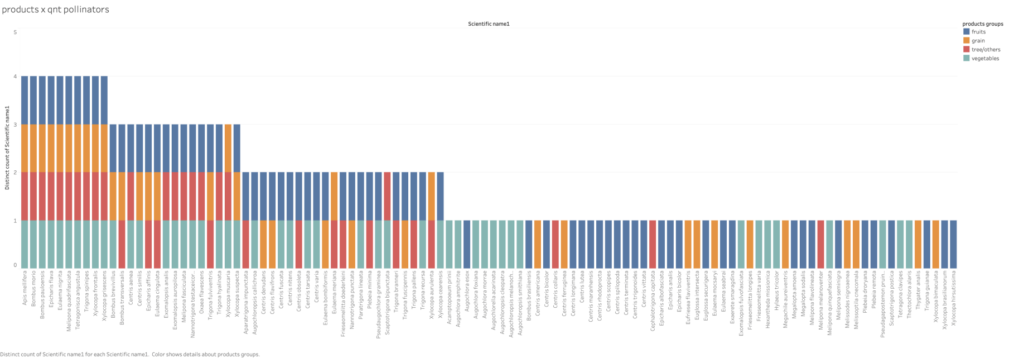
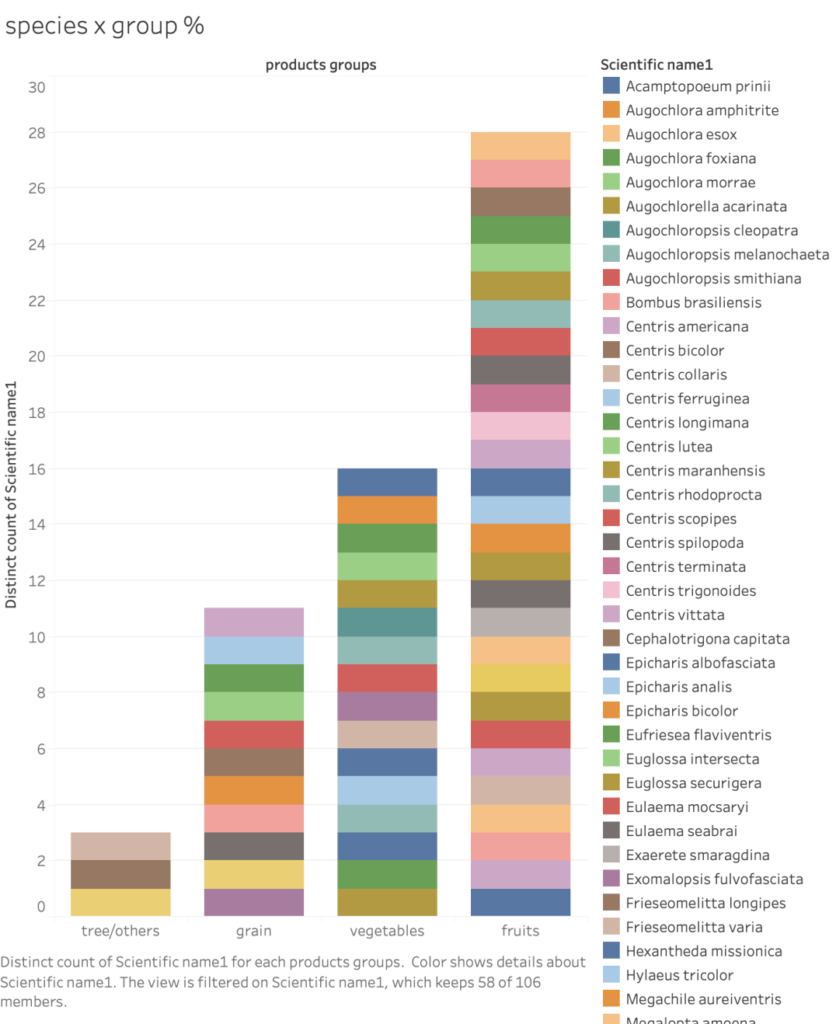
Species x product groups (count)
Vegetables and fruits are dominants inside the bees that pollinate group.
Species who pollinate fruit and vegetables
Inside one group is possible to have species w/ more than 1 product

Species that just pollinate fruit or vegetables
Focus on Açai
The 1st idea for the final project was to go deeply on one of the most popular fruit in Brazil. Than it was possible to study other table with the location and explore in Tableau the tool of Geolocation.
Raw materials on Table
As the table with the locations did not have the names of the species, it was necessary to modify the original table that showed the locations according to the Genus and specific epithet of the bee to reduce the table only to the species that pollinate the açai.
Also, It didn’t have the locations formatted to be georeferenced in Tableau.
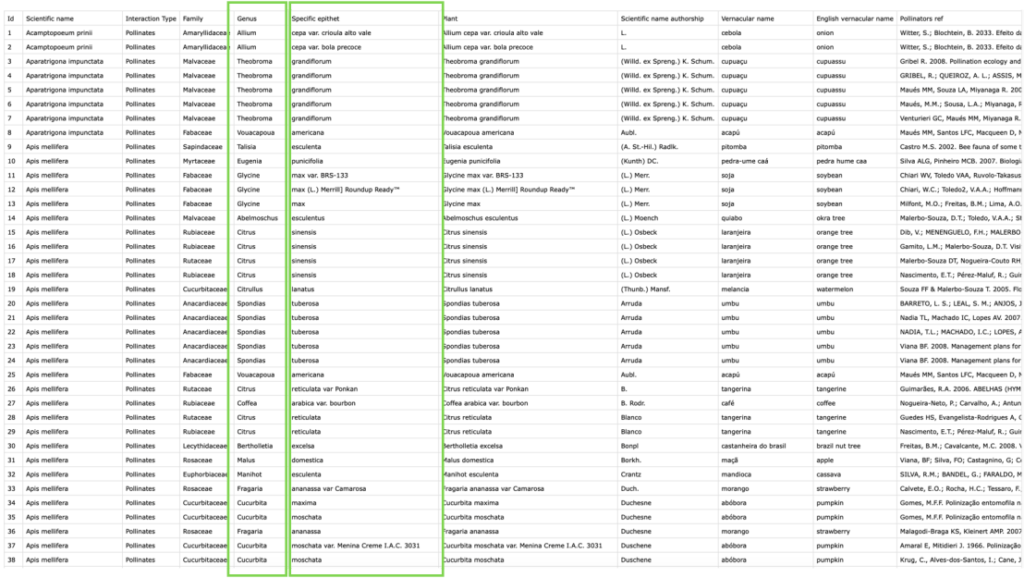
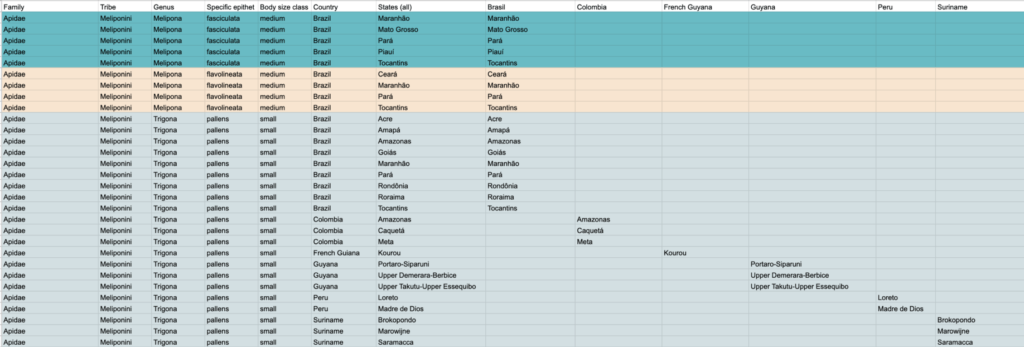
As there were no species names in this table, I filtered through Genus and Specific epithet to find the species those pollinate açai. From that I transformed the information from the locations that were all in a cell into different columns so that Tableau could recognize and georeference showing on the map.
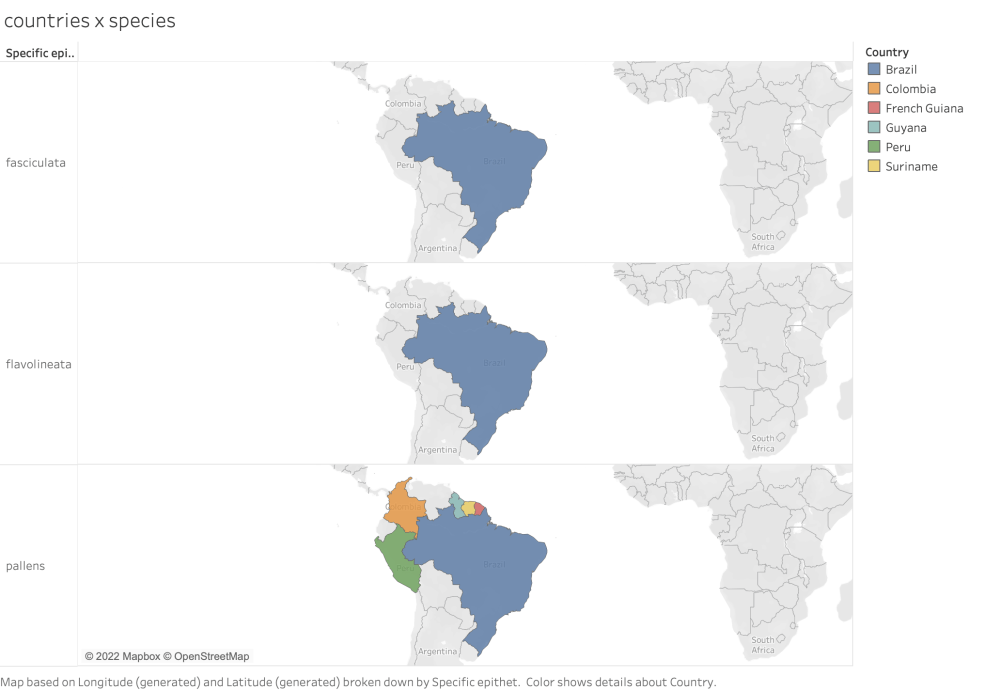
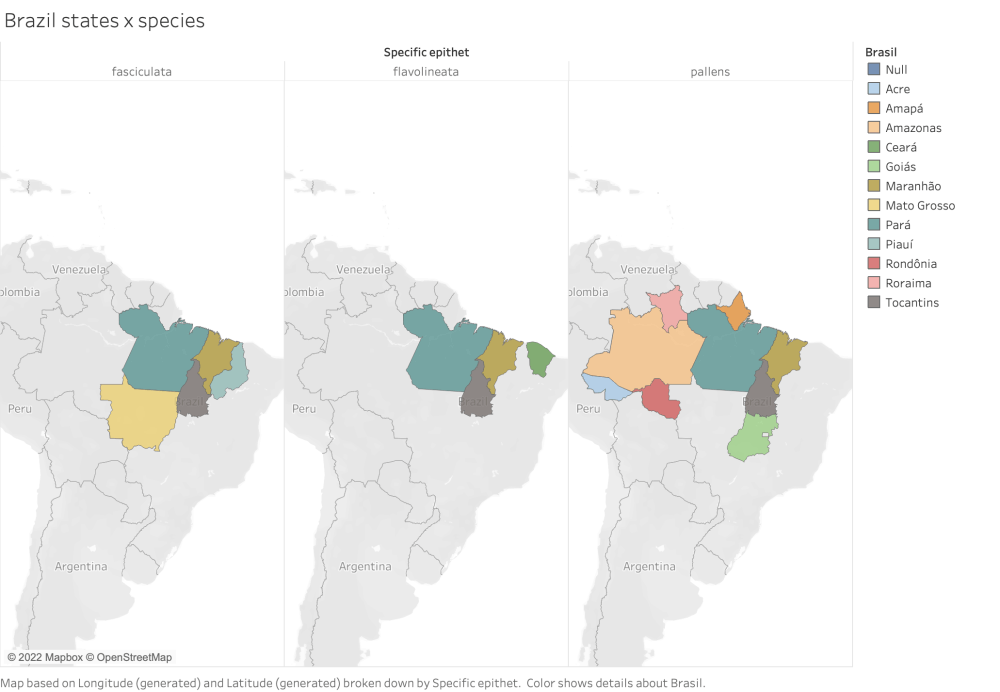
Geolocation Data
The açai tree is not a fruit that is planted, it needs favorable soil and climatic conditions and also needs an abundant fauna and flora and other species around. Through the database of geolocation, it is noticed that the bees that pollinate the açaí, also pollinate other fruits in other states. And its confirms the information.

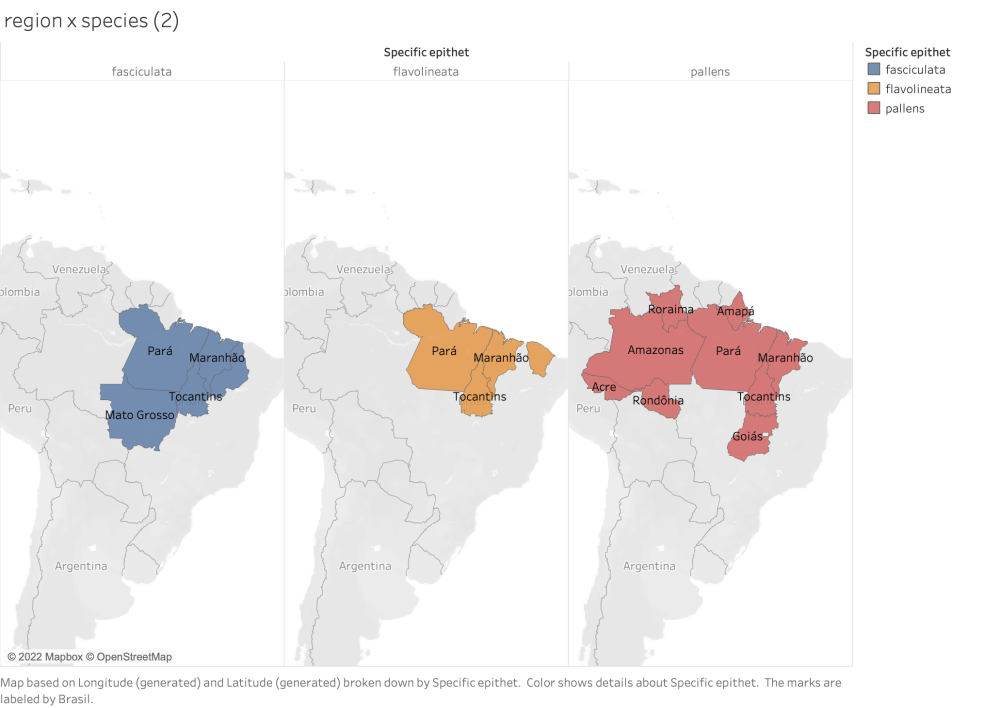
Same as the previous chart but with the names of the states in stead of color familiar with the states I think this case with the name on the draw is better to understand.
Conclusion before Final Project
In view of all the data visualized, I realized that I was heading to a project about a very specific product, which was açaí. But with the assistance with the teachers, I noticed that it could be more interesting to do a Data Driven Project exposing the abundance of products pollinated by bees, and that in addition to raising awareness of their importance, the project creatively brings information about these fruits that those who are not native probably don’t know.
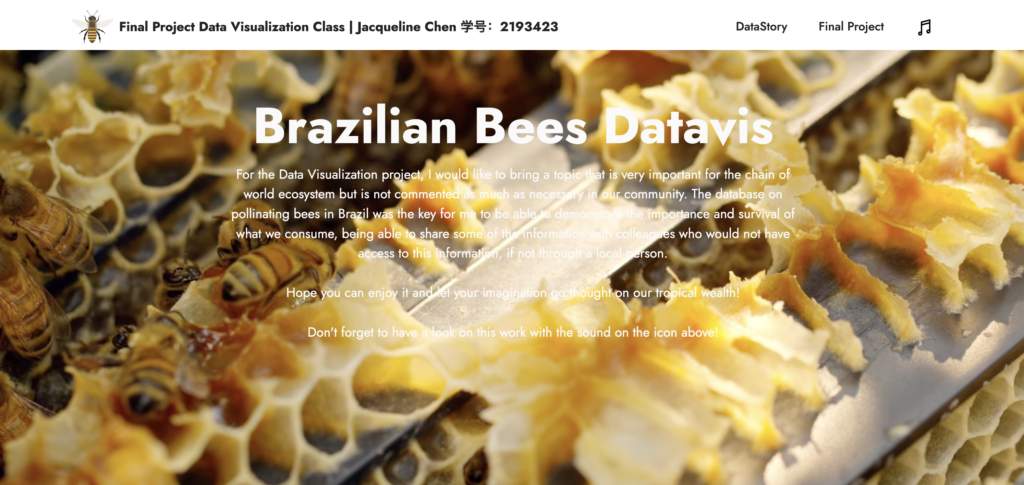
Brazil is a tropical country and well known for its warmth, music, parties, vibrant colors, warm, hardworking and happy people. Through my project, in addition to being informative, I want to bring it in a real and sensorial way to those who will see what reality is like in the country.
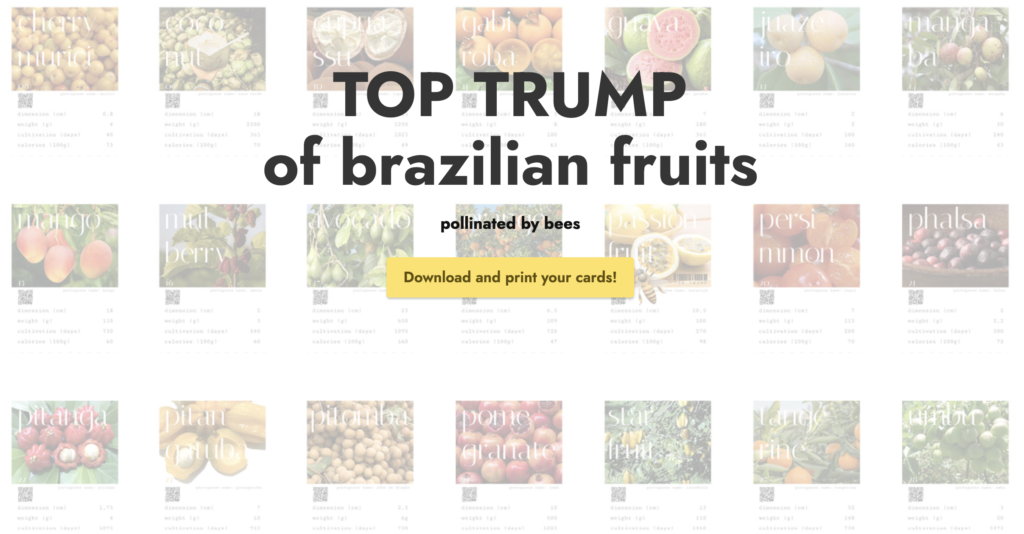
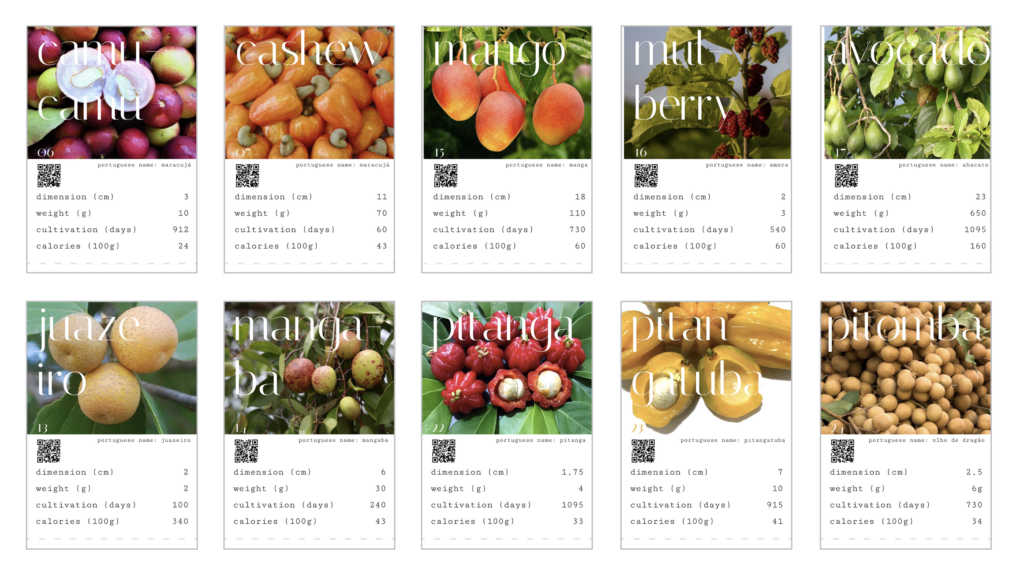
Top Trumps has 28 cards and each card contains a list of numerical data, and the aim of the game is to compare these values to try to trump and win an opponent’s card.
For this project, I changed some rules and added an information layer so that the game was more interactive and customized for the experience I would like the user to have.
Enjoy it!
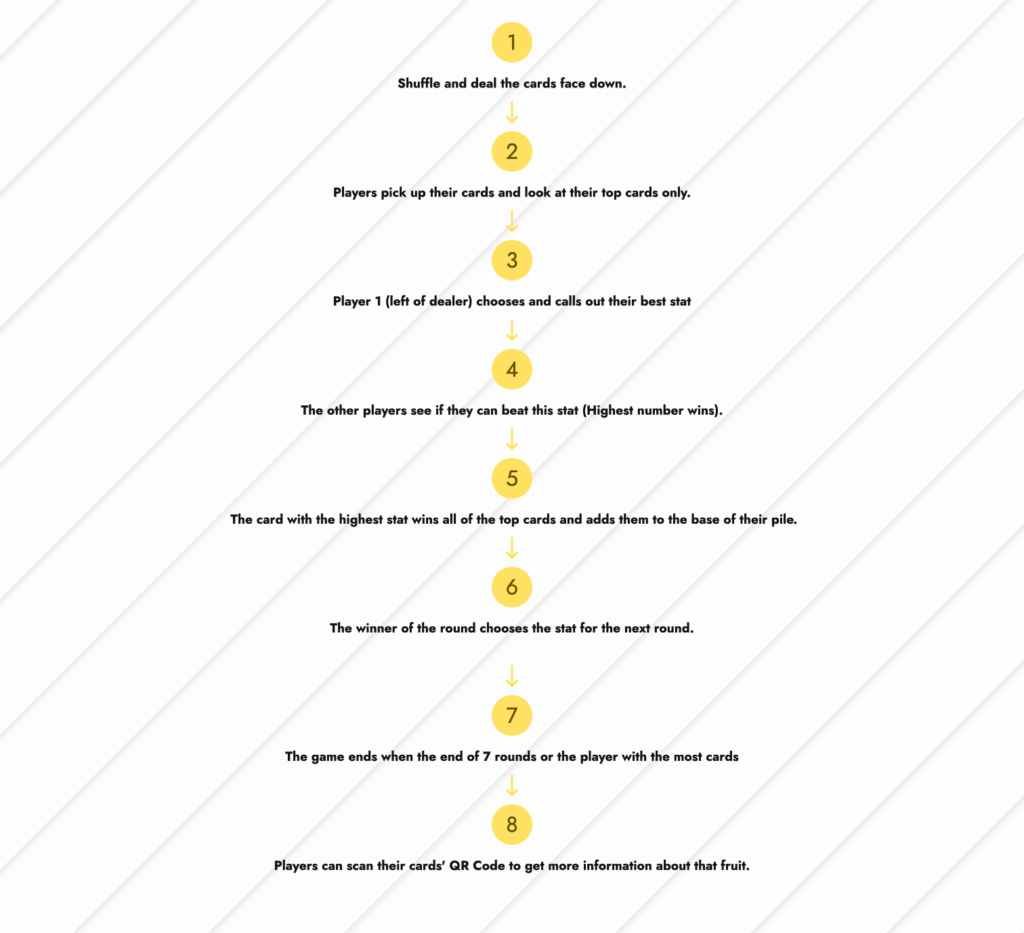
Rules of the game
Participants: 2 or more
Objective:
Get the most cards after 7 rounds
The game is based on comparing your card values with other players. For your card to win, the chosen trait must have a higher value than your opponents’ card.
SUPER TRUMP CARD
There is a TOP TRUMP card among the cards, it is the fruit that is pollinated by the most bees in the game. This card beats all cards in the deck regardless of the value of its characteristics. It only loses to the cards that have the number above it, marked above the QR Code.