Intro: an ecological dive
As designers, we are continuously asked to create and manipulate technology in order to support human thriving. This request needs to be reframed within the scope of the environmental challenges, meaning that technology would make sense where and when it may support all life to thrive.
There was a beautiful speech from Prof. Thackara at Tongji Design Week, which discusses AI in light of the benefit and the good that it may bring to an ecological restoration.
“Once we understand we are part of a living system, the reconnection with nature is not only possible, it becomes obvious. And once this reconnection is done, our creative priorities and our understanding of where to focus our energy and cultural energy can only change.”
Prof. Thackara
Frame Nature and Data
In this frame we talk about “nature”, for which we can create our own definition and understanding. Environmental DataVis, Nature Datavis, Datavis for Nature, Green Datavis, all and many more can apply. Students will find their own meaningful label. Therefore, one of our first challenges will be to define Nature – in which aspects it can be interpreted, seen, as a data rich context. On the other hand, what is crucial about data is exactly the relationships among them. So whatever is the “nature” interpretation, it is important to look with an ecological frame, meaning to keep “the relationship” as the centre of the study.

As a characteristic of this course, it is relatively open in subject although finalized in the results. We ask the teams to work on the concept of nature, to explore the manifold nuances which can be studied and analyzed using data, to seek and provide relevant datasets, and to use the data exploration as a roadmap for creating first design insights and then propositions. This is challenging, because data will be students’ focus and the key point of the research and design methodology.
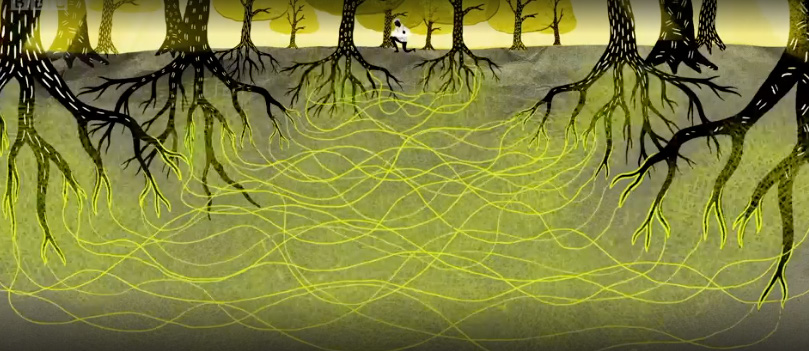
We can look at nature as a system – which brings us to history and places, to creatures and biodiversity, to bioregions and ecosystems to cities and wilderness. And as in every system, we can look at their entities, at their relationship, and at its dynamic.These perspectives are valid, both of them may be approached through datasets, and in between, there are many more which we invite you to discover.
Complexity is not something we have discovered recently

The goal of this course
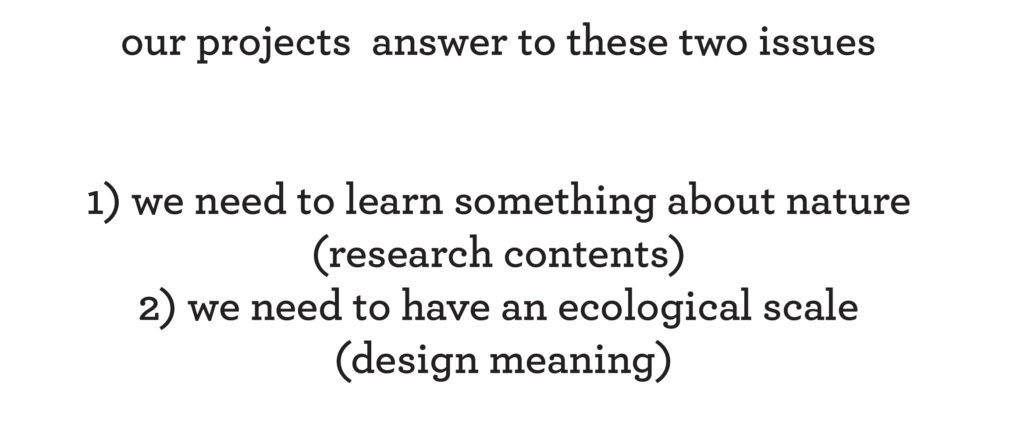
The goal of the course is to produce projects which are data-based and design-driven. We want students to understand and practice the use of data as a research tool (meaning to produce and inform research, and to guide the process from hypothesis to insights), and as a design tool, meaning to be embedded in the final artifacts, whichever they are.

As with every design project, we will pay attention to the context of usage of our proposition, and we will bring the project to the prototype stage. Students do not have any limitations in the final concept if not the agreement and the capabilities of the team. At the same time, we invite the students to think widely and to consider the possibility of final visualization which is mediated by 3D devices, which can be placed in a real context, which can be tested, manipulated, and used to serve a specific purpose.

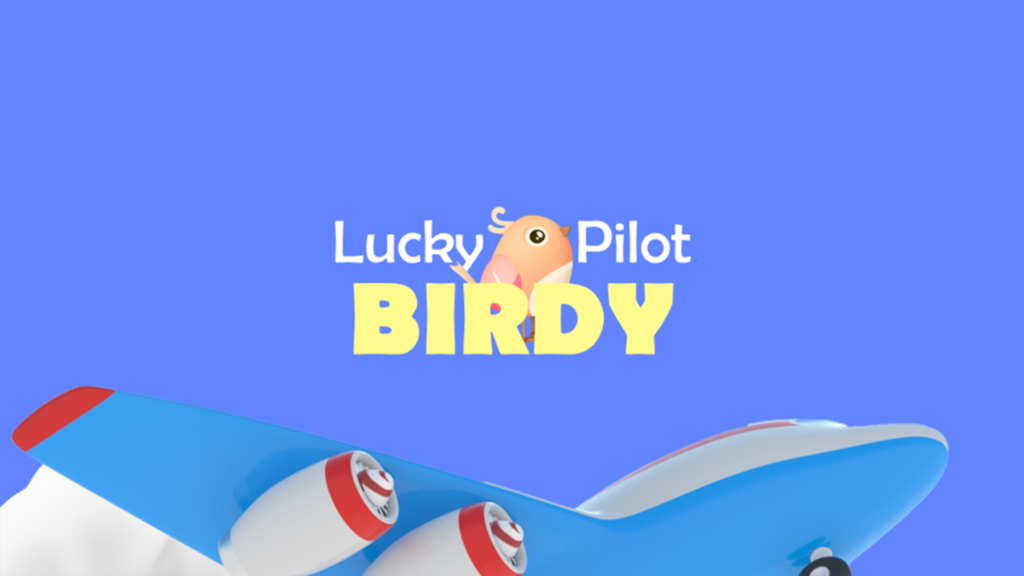
Projects


Pingback: The Contribute of Citizen Science to support Urban Nature and Ecological Literacy in Chinese Cities (NSFC grant ID#6201101276) – Ecology and Cultures Innovation Lab